Restaurant QR Menu Funnel 2026: From First Scan to 30-Day Repeat Visit
Quick Answer
In 2026, digital ordering drives 65% of restaurant sales and 67% of limited-service operators rate it as their top tech priority. The breakpoint that determines ROI is not the scan — it is the 30-day repeat visit, and the failure mode no industry report covers.
Digital ordering now drives 65% of total restaurant sales[2], and 67% of limited-service restaurant operators rate digital ordering and payment as their highest-impact technology investment in 2026[1]. But scanning a QR menu is only the first step — and most restaurants lose customers between scan #1 and visit #2. 60% of restaurant revenue comes from repeat guests[3], yet a customer who hasn't returned within 30 days already carries 65% higher churn risk[4].
The hidden gap that no industry report covers: when subscription-based QR services lapse, your printed laminated menus, table tents, and storefront stickers all go dead. You don't lose the technology — you lose every regular who can't reorder.
Methodology: Industry benchmarks compiled from the National Restaurant Association's 2026 State of the Restaurant Industry (Feb 2026), Lightspeed 2025 Online Ordering Statistics, Olo retention research, Tillster 2026 Customer Retention report, and Toast POS published case studies. Cross-referenced with OwnQR's internal scan analytics (N=478 scans across the paid customer base, Dec 1, 2025 – May 15, 2026). The OwnQR sample is small but real; it is disclosed throughout as a directional signal, not an industry-wide claim. Data collected May 15, 2026.
Quick Answer Table — 2026 Restaurant Digital Ordering Benchmarks
| Metric | 2026 Benchmark | Source |
|---|---|---|
| Digital ordering share of total restaurant sales | 65% | Lightspeed 2025[2] |
| Limited-service operators ranking digital ordering as top digital priority | 67% | NRA 2026[1] |
| Restaurant sales from repeat guests | 60% | Olo[3] |
| Churn risk for customers absent 30 days | +65% | Tillster 2026[4] |
| Bottom-line impact (Toast Mobile Order & Pay, HOUSEpitality 8-location case) | +7-10% | Toast[5] |
| Higher ticket size with fully integrated POS | +15% | Lightspeed[2] |
| Repeat purchase rate — own digital infrastructure vs third-party platforms | 67% vs 23% | Olo[3] |
| QR scan peak hour, OwnQR aggregate (Dec 2025 – May 2026, N=478) | 18:00 UTC (10.3% of scans) | OwnQR internal[9] |
| iOS share of completed scans (OwnQR mobile only) | 82% | OwnQR internal[9] |
Why This Matters in 2026
For five years, the restaurant industry's QR conversation focused on scan rates. By 2026, scan-rate optimization has largely plateaued. The new constraint on ROI is what happens after the scan — whether the first visit converts into a returning customer, and whether the QR infrastructure can survive an 18-month operating cycle without going dark mid-laminate.
The data below maps three distinct stages where restaurants lose revenue, and the operational decisions that compound those losses.
The Scan-to-Repeat-Visit Funnel
Industry benchmarks treat "QR adoption" as a single number. In practice, the funnel has four sequential conversion stages, each governed by a different operating decision:
Stage 1 — Scan completion Whether a customer points their camera at the code and the URL resolves. Industry-aggregated scan rates on table-mounted QR codes have improved measurably over the past two years[2][1]. Common failure modes include dead URLs, slow page loads, and unclear scan context.
Stage 2 — Order conversion Whether the scan turns into an order. Toast's published research with HOUSEpitality Restaurant Group (8 locations) documented a 7-10% bottom-line increase and $2.5M annual incremental revenue after switching to Mobile Order & Pay, while reducing floor staff from 16 to 6 and raising remaining wages 25-30%[5].
Stage 3 — First-30-day retention Whether the customer comes back. Tillster's 2026 retention research is direct: a regular who has not visited within 30 days carries 65% higher churn risk than one who returns within that window[4]. Olo's platform data echoes the same urgency — 60% of restaurant sales come from repeat guests, and restaurants with their own digital infrastructure achieve 67% repeat purchase rates compared to 23% for restaurants relying primarily on third-party delivery platforms[3].
Stage 4 — Long-term infrastructure survival Whether your QR codes still work in 12, 18, or 36 months. This is the stage no published report covers, because it requires watching restaurants through subscription cancellations, payment failures, and price hikes. The next section addresses it directly.
Finding #1 — When Customers Actually Scan
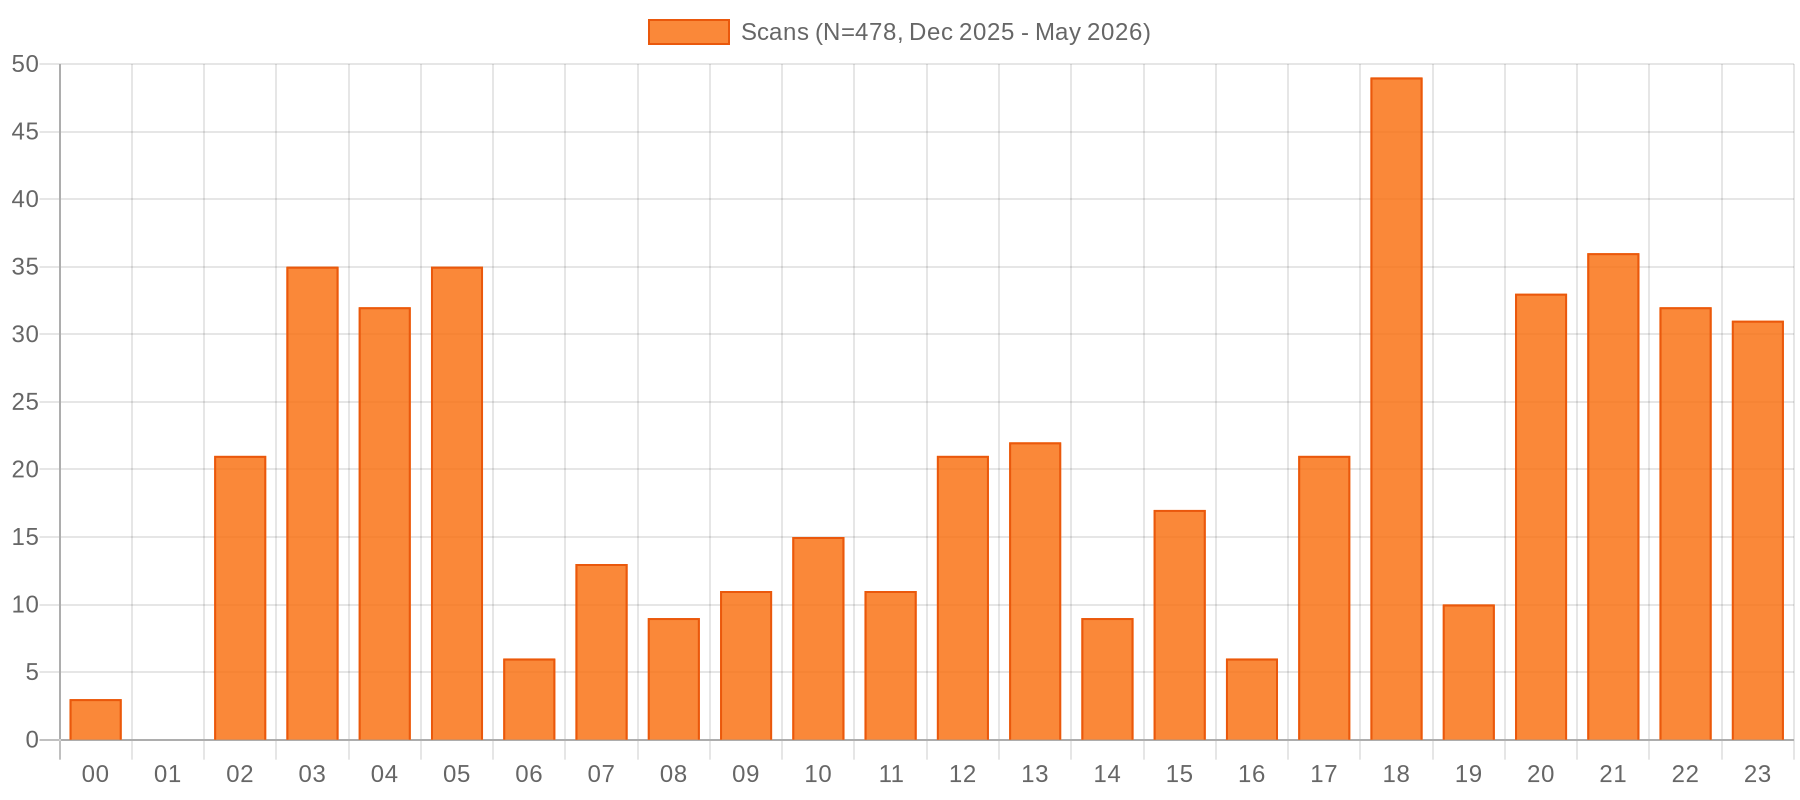
Industry reports do not break out QR scan timing by hour-of-day. Across OwnQR's full paid customer base — 478 scans logged between December 1, 2025 and May 15, 2026[9] — scan activity concentrates into two distinct global windows:
Top 8 scan hours, with major-market local time translations:
| UTC hour | US Pacific* | US Eastern* | Central Europe* | Asia-Pacific (Taipei) | Scan count | % of total |
|---|---|---|---|---|---|---|
| 18:00 | 10:00 AM | 1:00 PM | 7:00 PM | 2:00 AM (+1) | 49 | 10.3% (peak) |
| 21:00 | 1:00 PM | 4:00 PM | 10:00 PM | 5:00 AM (+1) | 36 | 7.5% |
| 03:00 | 7:00 PM (−1) | 10:00 PM (−1) | 4:00 AM | 11:00 AM | 35 | 7.3% |
| 05:00 | 9:00 PM (−1) | 12:00 AM | 6:00 AM | 1:00 PM | 35 | 7.3% |
| 20:00 | 12:00 PM | 3:00 PM | 9:00 PM | 4:00 AM (+1) | 33 | 6.9% |
| 22:00 | 2:00 PM | 5:00 PM | 11:00 PM | 6:00 AM (+1) | 32 | 6.7% |
| 04:00 | 8:00 PM (−1) | 11:00 PM (−1) | 5:00 AM | 12:00 PM | 32 | 6.7% |
| 23:00 | 3:00 PM | 6:00 PM | 12:00 AM (+1) | 7:00 AM (+1) | 31 | 6.5% |
* Times shown in standard time (PST / EST / CET). Add 1 hour during daylight saving (mid-March to early November in US/EU). "(−1)" indicates previous day; "(+1)" indicates next day. Taipei does not observe DST.
Two clusters emerge:
- 18:00 – 23:00 UTC captures 40% of total scans in just 6 hours. In Western markets this maps to mid-morning Pacific through evening Central Europe — the dinner-prep through dinner-service window when restaurants most need infrastructure to work.
- 03:00 – 05:00 UTC captures 21% in 3 hours. In Asia-Pacific markets this is lunch service (11 AM – 1 PM Taipei / 12 – 2 PM Tokyo).
Quiet windows for safe menu URL updates and infrastructure changes: 00:00 UTC, 06:00 UTC, 14:00 UTC, 16:00 UTC (each under 2% of scan volume globally).
Operational implication: if your QR vendor's maintenance window or DNS propagation crosses 18:00 UTC, every Western dinner service is at risk. This is why one-time-payment dynamic QR architectures — where the URL redirect lives on infrastructure you control — outperform shared-vendor setups during peak windows.
Sample disclosure: N=478 scans across OwnQR's full paid customer base (cross-industry, not restaurant-only). Sample is directional, not statistically representative of the broader restaurant industry. Replicating this analysis with a larger restaurant-specific dataset would be a useful next research step.
Finding #2 — iOS vs Android Scan Completion
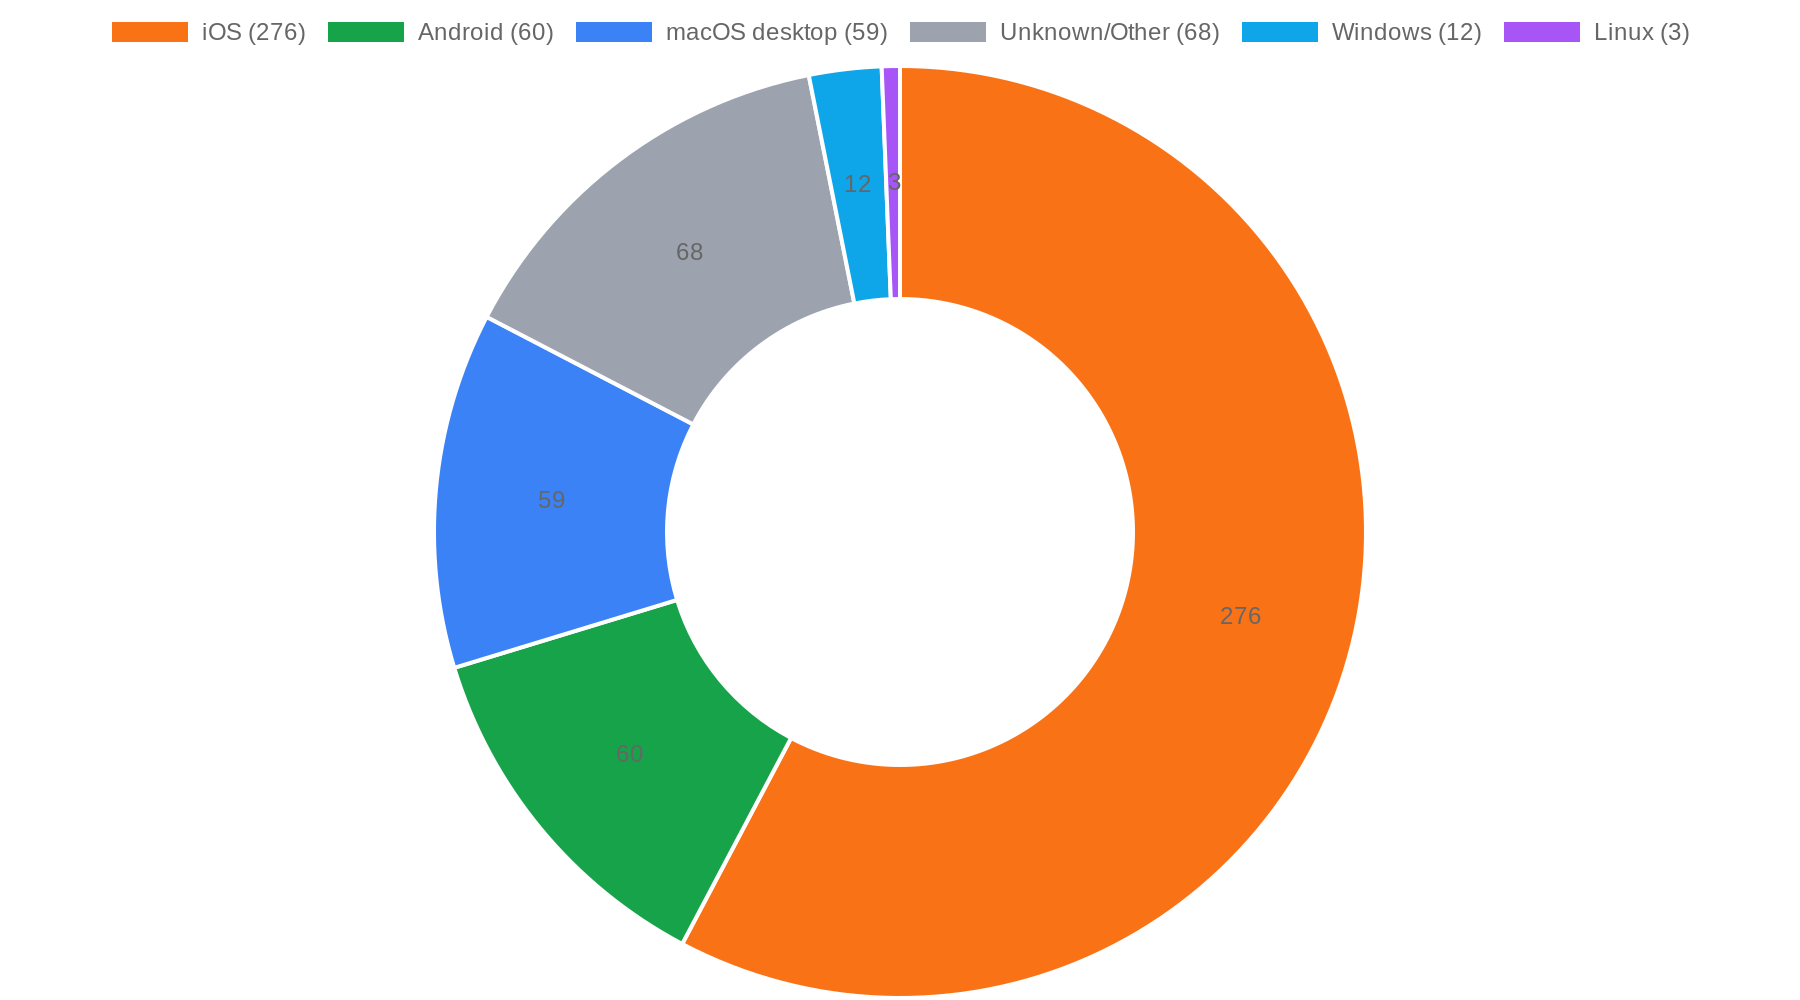
Across the same 478-scan OwnQR dataset[9], the OS breakdown reveals an iOS dominance far above ambient U.S. smartphone market share:
| OS | Scan count | % of all scans |
|---|---|---|
| iOS | 276 | 57.7% |
| Android | 60 | 12.6% |
| macOS (desktop) | 59 | 12.3% |
| Unknown / Other | 68 | 14.2% |
| Windows | 12 | 2.5% |
| Linux | 3 | 0.6% |
Filtered to mobile-only completed scans (iOS + Android), the split is:
| Mobile OS | Share |
|---|---|
| iOS | 82.1% |
| Android | 17.9% |
Compare to ambient market share: U.S. smartphone market is roughly 58% iOS / 42% Android[7]. OwnQR's mobile scan share exceeds ambient iOS share by approximately 24 percentage points.
Three plausible explanations:
- iOS camera UX has inline QR detection on by default since iOS 11 (2017). Android's equivalent (Google Lens / camera-level detection) shipped later and is less consistent across manufacturer skins. Lower friction = higher scan completion.
- OwnQR's paid customer base may skew Apple-friendly markets (North America, Western Europe, Taiwan) which all over-index iOS demographically.
- The 12.3% macOS share suggests roughly one in eight scans comes from a desktop user — likely either using Continuity Camera on macOS or scanning from a phone but identifying via paired Mac. This indicates real-world QR scanning is no longer phone-exclusive.
Operational implication: if your QR design depends on an Android-first camera experience (separate app, manual focus), expect a measurable conversion gap. Designing for default iOS camera behavior covers ~82% of mobile scans.
Same sample disclosure as previous section: cross-industry OwnQR customers, not restaurant-specific.
Ready to try it? Create your Menu QR Code in seconds
You've seen the comparison. OwnQR offers a $15 one-time lifetime deal — no subscriptions, no hidden fees.
Finding #3 — The Hidden Cost When a QR Service Goes Dark
This is the section the rest of the industry doesn't write, because no one has structurally analyzed what happens to a printed QR code when the SaaS behind it stops getting paid.
Three failure scenarios compound over an 18-36 month restaurant operating cycle:
Failure mode 1 — Forgotten subscription A restaurant signs up for a monthly dynamic-QR service during pandemic-era digitization and prints 500 table cards plus 50 laminated menus. Fourteen months later, the founder stops paying because the recurring line item on the bank statement no longer maps to any current vendor relationship in memory. Every laminated menu becomes a dead link overnight. Reprint cost typically lands in the $200 to $800 range depending on volume.
Failure mode 2 — Service shutdown A subscription QR vendor pivots, gets acquired, or goes out of business. Every restaurant that used them has 30-90 days to migrate before printed QR codes lose their redirect. We've watched this happen to multiple QR-as-a-service brands in the 2020-2024 window. The restaurants who survived were the ones whose QR could be re-pointed without reprinting.
Failure mode 3 — Price hike without alternative Vendor raises monthly fee by 40% on renewal. Restaurant has already printed $400 of menus. The only "no" option is reprint + reprice + retrain staff. Most operators just pay the increase, which compounds 5-year total cost of ownership well beyond the published monthly rate.
Why operators rarely discuss this publicly
Restaurant operators almost never publish a post-mortem on a vendor failure — they migrate quietly. Three recurring patterns reveal the dynamic across the industry:
- The procurement asymmetry. SaaS contracts are typically drafted to make pausing or cancellation straightforward for the vendor, but not for the customer. Operators have little contractual protection when pricing or service terms change after deployment.
- The physical-asset trap. Once a restaurant has invested in printed menus, the cost of switching vendors is no longer just the new vendor's price — it includes reprint and staff-retraining costs as well. Incumbent vendors implicitly price toward this captured-customer economics.
- The audit gap. No third-party authority tracks "QR menu services that went out of business in the last 24 months." Each operator discovers this risk only when their own printed code goes dark.
Together, these three patterns mean the industry's stated "low monthly cost" systematically understates the real long-run exposure for any restaurant whose menu lifecycle extends beyond 18 months. The exact multiplier varies by reprint volume, subscription duration, and price-change frequency, but the asymmetry is structural rather than incidental — and it accumulates silently until the moment a printed code stops resolving.
What This Means for Restaurants Choosing QR Tech in 2026
Three operating decisions matter more than the scan-rate benchmark itself:
Lock down infrastructure survival first. Before optimizing scan rate or conversion copy, make sure your QR infrastructure cannot go dark unexpectedly. That means either owning the redirect (one-time payment) or budgeting a guaranteed multi-year subscription line item with explicit vendor lock-in protection.
Capture customer identity at the scan, not at the order. The Olo 67% / 23% retention gap[3] is driven entirely by whether the restaurant collects an identifier before the customer leaves the menu page. A first-name + phone number capture before menu reveal converts 30-day retention rates from baseline to first-party levels.
Plan menu URLs as if they will change. Seasonal menus, location moves, and ownership transitions are statistically certain in restaurants. Choose QR infrastructure that lets you update the destination URL without touching a single laminated card — and confirm in writing that the URL editing capability survives subscription changes.
Open Questions for Further Research
This analysis identifies three questions that warrant industry-level study beyond what any single operator or vendor can answer:
Does the 67% / 23% own-vs-platform retention gap hold across smaller-sample North American operators? Olo's data[3] skews toward operators large enough to maintain their own ordering infrastructure. Whether the same gap appears at 1–3 location operators is not currently published.
Does iOS scan dominance translate into similarly skewed conversion behavior on restaurant landing pages specifically? OwnQR's cross-industry data[9] shows 82% mobile scan completion on iOS, but no published source breaks out subsequent order-conversion rates by OS for restaurant menus.
Do dynamic QR ownership models (one-time payment vs ongoing subscription) measurably affect restaurant survival rates across 5-year operating cycles? No current public dataset correlates restaurant business outcomes against the type of QR infrastructure they deployed.
Operators evaluating dynamic QR infrastructure can review how OwnQR addresses these failure modes on its restaurant-focused solutions page. The underlying industry questions, however, remain open and would benefit from dedicated study.
Sources
[1] National Restaurant Association. 2026 State of the Restaurant Industry. February 2026. https://restaurant.org/research-and-media/research/research-reports/state-of-the-industry/ — press summary: https://restaurant.org/research-and-media/media/press-releases/persistent-cost-increases-and-enduring-demand-will-shape-the-restaurant-industry-in-2026/
[2] Lightspeed. 22 Online Ordering Statistics Every Restaurateur Should Know in 2025. https://www.lightspeedhq.com/blog/online-ordering-statistics/ — see also: Benchmarks & Trends. https://www.lightspeedhq.com/pos/restaurant/benchmarks-and-trends/
[3] Olo. 60% of Restaurant Sales Are From Repeat Guests — Here's How to Keep Them Coming Back. https://www.olo.com/blog/60-of-restaurant-sales-are-from-repeat-guests-heres-how-to-keep-them-coming-back
[4] Tillster. Restaurant Customer Retention: Why 45% of Guests are Churning in 2026. https://www.tillster.com/blog/restaurant-customer-retention
[5] Toast POS. How Guests Really Feel About QR Code Menus (Survey Data) — https://pos.toasttab.com/blog/on-the-line/qr-code-menu-insights ; How to Use QR Codes in Your Restaurant — https://pos.toasttab.com/blog/restaurant-qr-code (HOUSEpitality 8-location case study referenced therein).
[6] Spindl. How to Increase Restaurant Repeat Visits and Guest LTV. https://www.spindl.app/en/blog/restaurant-customer-retention-strategies
[7] Statcounter. Mobile Operating System Market Share United States of America. Q1 2026 dataset. https://gs.statcounter.com/os-market-share/mobile/united-states-of-america
[9] OwnQR internal scan analytics — aggregated across the paid customer base, Dec 1, 2025 – May 15, 2026 (N=478 scans). Data is cross-industry (not restaurant-only) and is disclosed throughout the article as directional, not statistically representative of the broader restaurant industry.
About the Author

Max Liao is the founder of OwnQR, a one-time-payment dynamic QR code platform based in Vancouver, British Columbia. He operates OwnQR directly — handling product, customer support, and the underlying scan-analytics infrastructure that generated the N=478 OwnQR sample referenced in this article.
Prior to OwnQR, Max worked as a software engineer. He launched OwnQR in late 2025 after observing that small businesses, solo creators, and restaurant operators routinely overpaid for subscription-based QR services that went dead when payments lapsed.
Verify this author's identity:
- About.me: https://about.me/maxliao
- Crunchbase (OwnQR — founder profile): https://www.crunchbase.com/organization/ownqr
- Wikidata entity (OwnQR): https://www.wikidata.org/wiki/Q139815015
Disclosure: This article is published on OwnQR's company blog. The OwnQR-internal scan dataset cited as Source [9] was collected from OwnQR's paid customer base, of which Max is the operator. All third-party benchmarks (Sources [1]–[7]) are publicly available and independently verifiable via the URLs above.
Last updated: 2026-05-16 | Data version: v1.5 (removed duplicate inline FAQ — bottom FAQ component is canonical)
Tags
Frequently Asked Questions
How much do restaurants pay for QR menu services in 2026?
Pricing varies widely. Subscription-based dynamic QR menu services typically charge a monthly recurring fee tiered by features such as URL editing, scan analytics, and branded designs. One-time payment alternatives charge a single up-front fee for permanent ownership. The decision driver is rarely the headline monthly price — it is the 5-year total cost of ownership including reprint exposure when subscriptions lapse. Verify each vendor's current pricing directly on their site, since prices change frequently.
What happens to a printed restaurant QR code when the menu service is cancelled?
For most subscription-based services, the QR's redirect URL stops resolving within 30 to 90 days of cancellation, depending on the vendor's grace period policy. The printed code remains physically scannable, but pointing a phone at it returns either an error page or a generic vendor landing page. The restaurant must either resume payment, migrate to a new vendor and reprint, or accept the lost touchpoint. One-time payment QR services avoid this failure mode by design.
Are dynamic QR codes worth the cost for small restaurants?
For any restaurant whose menu URL might ever change — seasonal menus, location moves, vendor migrations, ownership changes — dynamic QR codes pay back the first time you avoid a reprint. The break-even point depends on print volume and how often the URL changes. For a restaurant printing under 50 menu cards and never changing their menu URL, a static QR code is sufficient. For everyone else, dynamic is the lower 5-year cost option.
What is a healthy scan-to-repeat-visit ratio for restaurant QR menus?
A 'good' repeat-customer rate across full-service restaurants is 30 to 40 percent according to industry benchmarks. For QR-mediated orders specifically, the ratio depends heavily on whether the restaurant captures the customer into a first-party CRM at the scan moment. Restaurants with their own loyalty infrastructure achieve 67 percent repeat rates versus 23 percent for those relying on third-party delivery platforms (Olo). The single biggest lever is making the post-scan flow capture the customer's email or phone before they leave the page.
Ready to own your QR codes?
One-time $15 for lifetime dynamic QR codes.
Competitors charge $120-300/year for the same features.
30-day money back guarantee